CHAPTER 2 LITERATURE REVIEWS 2.1 Risperidone
(Risperdal®) is a psychotropic agent belonging to the chemical class of
benzisoxazole derivatives. The chemical designation is 3-[2-[4-(6-fluoro-1, 2-benzisoxazol- 3-yl)-1-piperidinyl] ethyl]-6,7,8,9-tetrahydro- 2-methyl-4H-pyrido [1,2-a]pyrimidin- 4-one. Its molecular formula is C23H27FN4O2 (Figure 1) and its molecular weight is 410.49 (Leysen et al., 1988).
Figure 1. Structural formula of risperidone (Avenoso et al., 2000)
Risperidone is a white to slightly beige powder. It is practically insoluble in water,
freely soluble in methylene chloride, and soluble in methanol and 0.1 N HCl. Risperdal® tablets are available in 0.25 mg (dark yellow), 0.5 mg (red-brown), 1 mg (white), 2 mg (orange), 3 mg (yellow), and 4 mg (green) strengths. Tablets of 0.25, 0.5, 2, 3, and 4 mg also contain talc and titanium dioxide. Risperdal® is also available as a 1 mg/mL oral solution. The inactive ingredients for this solution are tartaric acid, benzoic acid, sodium hydroxide, and purified water (Janssen et al., 1988).
2.1.1 The mechanism of action of risperidone
The mechanism of action of risperidone, as with other antipsychotic drugs, is
unknown. However, In vitro studies have shown that risperidone acts primarily as a serotonin
(5-HT2) and dopamine (D2) antagonist. It binds with highest affinity to serotonergic receptors. Risperidone also binds to alpha-1 and alpha-2 adrenergic and histamine (H1) receptors, although with much less affinity. Dissociation from 5-HT2 and H1 receptors is slow; however, the drug rapidly dissociates from dopaminergic and alpha adrenergic receptors. The potency of risperidone as a dopamine (D2) antagonist is less than that of haloperidol, and its 5-HT2 antagonist potency is greater than that of ritanserin. Risperidone interacts weakly or not at all with other receptor and neurotransmitter systems, including cholinergic receptors (Anon, 1991; Anon, 1993; Borison, 1994; Leysen et al., 1988; Niemegeers et al., 1988). Studies have shown that there is an exponential dose-response relationship between the daily dose of risperidone and the dopamine (D2) receptor occupancy (Nair, 1998; Remington et al., 1998). The slope of the curve is between that of haloperidol and clozapine but more closely resembles haloperidol. One study did find that extrapyramidal effects were linked to (D2) occupancy with those individuals manifesting symptoms having the highest percentage of binding (Remington et al, 1998). Another study found no clear relationship between symptoms and D2 occupancy. They hypothesized that the decreased incidence of extrapyramidal effects seen with risperidone is not due to the low binding at the D2 receptor but to risperidone's high 5-HT2 affinity providing a relative protection from symptoms (Nair, 1998). Animal studies have shown that risperidone inhibits tryptamine and serotonin-induced cyanosis and 5-hydroxytryptophan-induced head twitching; it also blocks central and peripheral manifestations of dopaminergic stimulation, including apomorphine-induced emesis and apomorphine or amphetamine-induced stereotype or hypermotility (Anon, 1991; Megens et al., 1988). Risperidone is several times less potent than haloperidol in the inhibition of locomotion and induction of catalepsy; in addition, risperidone causes a significant increase in deep sleep, corresponding to the effect of ritanserin (Borison, 1994). Potent alpha-2 adrenoceptor blockade has been demonstrated with risperidone, as it reverses clonidine inhibition of potassium-induced norepinephrine release in occipital cortex. It also exhibits complete and potent lysergic acid diethylamide (LSD) antagonism in animals (Anon, 1991; Leysen et al., 1988; Niemegeers et al., 1988). Marder et al. (1994) reported that in controlled clinical trials, optimal therapeutic effects were seen in the 4 to 8 mg per day dose rang. However, clinical experience in dicicates that in the majority of patients adequate therapeutic effect is achieved at the 6 mg per day dose. Doses above 10 mg per day have not been shown to be more efficacious than lower doses and were associated with more
extrapyramidal symptoms and other adverse events. The safety of risperidone has not been established above 16 mg total daily dose, administered twice daily. If administered once daily, safety has not been established beyond a single dose of 8 mg. The dose of risperidone should be adjusted gradually over several days based on clinical response to a target dose of 4 to 6 mg per day. Some patients may benefit from lower initial doses and/or a shower adjustment schedule.
Phamacokineticof risperidone Bioavailability
Risperidone is well absorbed. The relative oral bioavailability
from a tablet was 94% (CV=10%) when compared to a solution (Nyberg et al., 1993; Muller- Spahn, 1992). Food does not affect either the rate or extent of absorption of risperidone. Thus, risperidone can be given with or without meals. The absolute oral bioavailability of risperidone was 70% (CV=25%). Distribution: The plasma protein binding of risperidone was about 90% over the in vitro concentration range of 0.5 to 200 ng/ml and increased with increasing concentrations of γ1-acid glycoprotein. The plasma binding of 9-hydroxyrisperidone was 77%. Neither the parent nor the metabolite displaced each other from the plasma binding sites. High therapeutic concentrations of sulfamethazine (100 µg/ml), warfarin (10 µg/ml), and carbamazepine (10 µg/ml) caused only a slight increase in the free fraction of risperidone at 10 ng/ml and 9- hydroxyrisperidone at 50 ng/ml, changes of unknown clinical significance. Data from one report show that the distribution of risperidone and 9-hydroxyrisperidone into breast milk is modest. Based on breast milk samples, the calculations indicate that an infant would receive 0.84% of the maternal dose as risperidone and an additional 3.46% from 9-hydroxyrisperidone. The total estimated dose exposure (as risperidone equivalents) was some 4.3% of the weight-adjusted maternal dose. If women are breast-feeding, their infants should be monitored closely for possible risperidone- related adverse effects (Scordo et al., 1999). Metabolism and elimination: Risperidone is extensively metabolized in the liver by cytochrome P450 2D6 (CYP 2D6) to a major active metabolite, 9-hydroxyrisperidone, which is the predominant circulating metabolite, and appears approximately equi-effective with risperidone with respect to receptor binding activity and some effects in animals. (A second minor pathway is N-dealkylation). Metabolism is sensitive to the debrisoquine hydroxylation
type genetic polymorphism (Nyberg et al., 1993). Consequently, the clinical effect of the drug likely results from the combined concentrations of risperidone plus 9-hydroxyrisperidone. Plasma concentrations of risperidone, 9-hydroxyrisperidone, and risperidone plus 9-hydroxyrisperidone are dose proportional over the dosing range of 1 to 16 mg daily (0.5 to 8 mg twice a day).
7-hydroxyrisperidone CYP 2D4 9- hydroxyrisperidone Risperidone CYP 3A4 CYP 3A4 Inactive acidic metabolite Inactive acidic metabolite
Figure 2. The major pathway of risperidone metabolism (Scordo et al., 1999)
The enzyme catalyzing hydroxylation of risperidone to 9-hydroxyrisperidone is CYP
2D6, also called debrisoquin hydroxylase, the enzyme responsible for metabolism of many neuroleptics, antidepressants, antiarrhythmics, and other drugs. CYP 2D6 is subject to genetic polymorphism (about 6-8% of caucasians, and a very low percent of Asians have little or no activity and are "poor metabolizers") and to inhibition by a variety of substrates and some non-substrates, notably quinidine. Extensive metabolizers convert risperidone rapidly to 9-hydroxyrisperidone, while poor metabolizers convert it much more slowly. Extensive metabolizers, therefore, have lower risperidone and higher 9-hydroxyrisperidone concentrations than poor metabolizers. Following oral administration of solution or tablet, mean peak plasma concentrations occurred at about 1 hour. Peak 9-hydroxyrisperidone occurred at about 3 hours in extensive metabolizers, and 17 hours in poor metabolizers. The apparent half-life of risperidone was 3 hours (CV=30%) in extensive metabolizers and 20 hours (CV=40%) in poor
metabolizers. The apparent half-life of 9-hydroxyrisperidone was about 21 hours (CV=20%) in extensive metabolizers and 30 hours (CV=25%) in poor metabolizers (Scordo et al., 1999). Steady-state concentrations of risperidone are reached in 1 day in extensive metabolizers and would be expected to reach steady state in about 5 days in poor metabolizers. Steady state concentrations of 9-hydroxyrisperidone are reached in 5-6 days (measured in extensive metabolizers). Because risperidone and 9-hydroxyrisperidone are approximately equi-effective, the sum of their concentrations is pertinent. The pharmacokinetics of the sum of risperidone and 9-hydroxyrisperidone, after single and multiple doses, were similar in extensive and poor metabolizers, with an overall mean elimination half-life of about 20 hours. In analyses comparing adverse reaction rates in extensive and poor metabolizers in controlled and open studies, no important differences were seen. Risperidone could be subject to 2 kinds of drug-drug interactions. First, inhibitors of CYP 2D6 could interfere with conversion of risperidone to 9-hydroxyrisperidone. This in fact occurs with quinidine, giving essentially all recipients a risperidone pharmacokinetic profile typical of poor metabolizers. The favorable and adverse effects of risperidone in patients receiving quinidine have not been evaluated, but observations in a modest number of poor metabolizers given risperidone do not suggest important differences between poor and extensive metabolizers. It would also be possible for risperidone to interfere with metabolism of other drugs metabolized by CYP 2D6.
2.1.3 Indication
Risperidone is indicated for the management of the manifestations of psychotic
disorders. The antipsychotic efficacy of risperidone was established in short-term (6 to 8 weeks) controlled trials of schizophrenic inpatients. The effectiveness of risperidone in long-term use, that is more than 6 to 8 weeks, has not been systematically evaluated in controlled trials. Therefore, the physician who elects to use risperidone for extended periods should periodically re-evaluate the long-term usefulness of the drug for the individual patient (Chouinard and Arnott, 1993).
2.1.4 Dosage and administration Usual initial dose: Risperidone should be administered on bid basis. In early clinical
trials, risperidone was generally administered at 1 mg bid initially, with increases in increments
of 1 mg bid on the second and third day, as tolerated, to a target dose of 3 mg bid by the third day. Subsequent controlled trials have indicated that total daily risperidone doses of up to 8 mg regimen are also safe and effective. However, regardless of which regimen is employed, in some patients a slower titration may be medically appropriate. Further dosage adjustments, if indicated, should generally occur at intervals of not less than 1 week, since steady state for the active metabolite would not be achieved for approximately 1 week in the typical patient. When dosage adjustments are necessary, small dose increments/decrements of 1-2 mg are recommended. Antipsychotic efficacy was demonstrated in a dose range of 4 to 16 mg/day in the clinical trials supporting effectiveness of risperidone, however, maximal effect was generally seen in a range of 4 to 8 mg/day. Doses above 6 mg/day for bid dosing were not demonstrated to be more efficacious than lower doses, were associated with more extrapyramidal symptoms and other adverse effects, and are not generally recommended. The efficacy results were generally stronger for 8 mg than for 4 mg. The safety of doses above 16 mg/day has not been evaluated in clinical trials (Niemegeers et al., 1988)
Dosage in special populations: The recommended initial dose is 0.5 mg bid in patients who are elderly or debilitated, patients with severe renal or hepatic impairment, and patients either predisposed to hypotension or for whom hypotension would pose a risk. Dosage increases in these patients should be in increments of no more than 0.5 mg bid. Increases to dosages above 1.5 mg bid should generally occur at intervals of at least 1 week. In some patients, slower titration may be medically appropriate. Elderly or debilitated patients, and patients with renal impairment, may have less ability to eliminate risperidone than normal adults. Patients with impaired hepatic function may have increases in the free fraction of the risperidone, possibly resulting in an enhanced effect. Patients with a predisposition to hypotensive reactions or for whom such reactions would pose a particular risk likewise need to be titrated cautiously and carefully monitored. If once-a-day dosing regimen in the elderly or debilitated patient is being considered, it is recommended that the patient be titrated on a twice-a-day regimen for 2-3 days at the target dose. Subsequent switches to a once-a-day dosing regimen can be done thereafter (Nair, 1998). Pediatric use: Safety and effectiveness in pediatric patients have not been established (Niemegeers et al., 1988). Maintenance therapy: While there is no evidence available to answer the question of how long should the patient be treated with risperidone should remain on it, the effectiveness of maintenance treatment is well established for many other antipsychotic drugs. It is recommended that responding patients be continued on risperidone, but at the lowest dose needed to maintain remission. Patients should be periodically reassessed to determine the need for maintenance treatment (Bersani et al., 1988). Reinitiation of treatment in patients previously discontinued: Although there are no data to specifically address reinitiation of treatment, it is recommended that when restarting of treatment in patients who have had an interval of free from risperidone, the initial titration schedule should be followed (Niemegeers et al., 1988). Switching from other antipsychotics: There are no systematically collected data to specifically address switching from other antipsychotics to risperidone, or concerning concomitant administration with other antipsychotics. While immediate discontinuation of the previous antipsychotic treatment may be acceptable for some patients, more gradual discontinuation may be most appropriate for other patients. In all cases, the period of overlapping antipsychotic administration should be minimized. When switching patients from depot antipsychotics, if medically appropriate, initiate risperidone therapy in place of the next scheduled injection. 2.1.5. Adverse reactions Dose Dependency of Adverse Events Extrapyramidal symptoms: Data from 2 fixed dose trials provided evidence of dose- relatedness for extrapyramidal symptoms associated with risperidone treatment. Two methods were used to measure extrapyramidal symptoms (EPS) in an 8-week trial comparing 4 fixed doses of risperidone (2, 6, 10, and 16 mg/day), including (1) a parkinsonism score (mean change from baseline) from the Extrapyramidal Symptom Rating Scale and (2) incidence of spontaneous complaints of EPS (Bersani et al., 1990). Other adverse events: Adverse event data elicited by a checklist for side effects from a large study comparing 5 fixed doses of risperidone (1, 4, 8, 12, and 16 mg/day) were explored
for dose-relatedness of adverse events. A Cochran-Armitage Test for trend in these data revealed a positive trend (p<0.05) for the following adverse events: Sleepiness, increased duration of sleep, accommodation disturbances, orthostatic dizziness, palpitations, weight gain, erectile dysfunction, ejaculatory dysfunction, orgastic dysfunction, asthenia/lassitude/increased fatiguability, increased pigmentation (Marder et al., 1997).
Vital sign changes: Risperidone is associated with orthostatic hypotension and tachycardia (Marder et al., 1997). Weight changes: The highest risk of weight gain was seen in patients who were young and had not been previously treated with neuroleptics (Luchins, 1998). Risperidone-treated adolescents had significantly higher weight gains and increases in body mass index (BMI) than adolescents treated with conventional neuroleptic agents (p=0.0141 and p=0.0011, respectively). Laboratory changes: A between group comparison for 6 to 8 week placebo-controlled trials revealed no statistically significant risperidone/placebo differences in the proportions of patients experiencing potentially important changes in routine serum chemistry, hematology, or urinalysis parameters. Similarly, there were no risperidone/placebo differences in the incidence of discontinuations for changes in serum chemistry, hematology, or urinalysis. However, risperidone administration was associated with increases in serum prolactin (Marder et al., 1997). ECG changes: The electrocardiograms of approximately 380 patients who received risperidone and 120 patients who received placebo in 2 double-blind, placebo-controlled trials were evaluated and revealed one finding of potential concern (i.e., 8 patients taking risperidone whose baseline QTc interval was less than 450 msec were observed to have QTc intervals greater than 450 msec during treatment. Changes of this type were not seen among about 120 placebo patients, but were seen in patients receiving haloperidol 3/126 (Mesotten et al., 1989). Other events observed during the pre-marketing evaluation of risperidone
During its premarketing assessment, multiple doses of risperidone were administered to
2607 patients in phase 2 and 3 studies. The conditions and duration of exposure to risperidone
varied greatly, and included (in overlapping categories) open and double-blind studies, uncontrolled and controlled studies, inpatient and outpatient studies, fixed-dose and titration studies, and short-term or longer-term exposure (Peuskens, 1995). In most studies, untoward events associated with this exposure were obtained by spontaneous report and recorded by clinical investigators using terminology of their own choosing. Consequently, it is not possible to provide a meaningful estimate of the proportion of individuals experiencing adverse events without first grouping similar types of untoward events into a smaller number of standardized event categories. In 2 large studies, adverse events were also elicited utilizing the UKU (direct questioning) side effect rating scale, and these events were not further categorized using standard terminology. In the listings that follow, spontaneously reported adverse events were classified using World Health Organization (WHO) preferred terms. The frequencies presented, therefore, represent the proportion of the 2607 patients exposed to multiple doses of risperidone who experienced an event of the type cited on at least one occasion while receiving risperidone. It is important to emphasize that, although the events reported occurred during treatment with risperidone, they were not necessarily caused by it (Peuskens, 1995).
Events are further categorized by body system and listed in order of decreasing frequency according to the following definitions: Frequent adverse events are those occurring in at least 1/100 patients (only those not already listed in the tabulated results from placebo- controlled trials appear in this listing); infrequent adverse events are those occurring in 1/100 to 1/1000 patients; rare events are those occurring in fewer than 1/1000 patients (Marder et al., 1989) Adverse event Frequent Infrequent Psychiatric
Increased dream activity Impaired concentration,
Disorders
diminished sexual desire depression, catatonic
reaction, euphoria, increased withdrawal syndrome, libido, amnesia
Adverse event Frequent Infrequent
increased sleep duration Dysarthria, vertigo, stupor, tongue paralysis, leg
Whole/General Disorders Respiratory Syste Disorders
bronchospasm, pneumonia, sputum, aspiration stridor
increased pigmentation Increased sweating, acne,
Appendage Disorders Cardiovascular Disorders Vision Disorders Adverse event Frequent Infrequent Metabolic and Nutritional Disorders Metabolic and Nutritional Disorders (cont.) Urinary System polyuria/polydipsia Disorders Musculo-skeletal System Disorders Reproductive Disorders
dysfunction,dry vagina amenorrhea, female breast
Liver and Biliary
increased SGOT, increased hepatic failure,
System Disorders Adverse event Frequent Infrequent Platelet, Bleeding and Clotting Disorders Hearing and Vestibular Disorders Red Blood Cell Disorders Reproductive Disorders, Male Erectile dysfunction. White Cell and Resistance Disorders Endocrine Disorders
breast pain, antidiuretic hormone disorder
Adverse events reported since market introduction which were temporally (but not
necessarily causally) related to risperidone therapy, include the following: anaphylactic reaction, angioedema, apnea, atrial fibrillation, cerebrovascular disorder, diabetes mellitus aggravated, including diabetic ketoacidosis, intestinal obstruction, jaundice, mania, pancreatitis, Parkinson's disease aggravated, pulmonary embolism (Umbricht and Kane, 1995). There have
been rare reports of sudden death and/or cardiopulmonary arrest in patients receiving risperidone. A causal relationship with risperidone has not been established. It is important to note that sudden and unexpected death may occur in psychotic patients whether they remain untreated or whether they are treated with other antipsychotic drugs.
2.1.6. Drug abuse and dependence Controlled substance class: Risperidone is not a controlled substance. Physical and psychological dependence: Risperidone has not been
systematically studied in animals or humans for its potential for abuse, tolerance or physical dependence. While the clinical trials did not reveal any tendency for any drug-seeking behavior, these observations were not systematic and it is not possible to predict on the basis of this limited experience the extent to which a CNS-active drug will be misused, diverted, and/or abused once marketed. Consequently, patients should be evaluated carefully for a history of drug abuse, and such patients should be observed closely for signs of risperidone misuse or abuse (e.g., development of tolerance, increases in dose, drug-seeking behavior).
2.1.7. Drug interactions
The interactions of risperidone and other drugs have not been systematically evaluated. Given the primary CNS effects of risperidone, caution should be considered when risperidone is taken in combination with other centrally acting drugs and alcohol. Because of its potential for inducing hypotension, risperidone may enhance the hypotensive effects of other therapeutic agents with this potential. Risperidone may antagonize the effects of levodopa and dopamine agonists. Chronic administration of carbamazepine with risperidone may increase the clearance of risperidone. Chronic administration of clozapine with risperidone may decrease the clearance of risperidone (Gutierrez-Esteinur et al., 1995). Fluoxetine may increase the plasma concentration of the anti-psychotic fraction (risperidone plus 9-hydroxyrisperidone) by raising the concentration of risperidone, although not the active metabolite, 9-hydroxyrisperidone. Drugs that Inhibit Cytochrome P 450 2D6 and Other P 450 Isozymes: Risperidone is metabolized to 9-hydroxyrisperidone by CYP 2D6, an enzyme that is polymorphic in the population and that can be inhibited by a variety of psychotropic and other drugs. Drug
interactions that reduce the metabolism of risperidone to 9-hydroxyrisperidone would increase the plasma concentrations of risperidone and lower the concentrations of 9-hydroxyrisperidone. Analysis of clinical studies involving a modest number of poor metabolizers does not suggest that poor and extensive metabolizers have different rates of adverse effects. No comparison of effectiveness in the 2 groups has been made. In vitro studies showed that drugs metabolized by other CYP isozymes, including 1A1, 1A2, 2C9, MP, and 3A4, are only weak inhibitors of risperidone metabolism (Megen et al., 1997). Drugs Metabolized by CYP 2D6: In vitro studies indicate that risperidone is a relatively weak inhibitor of CYP 2D6. Therefore, risperidone is not expected to substantially inhibit the clearance of drugs that are metabolized by this enzymatic pathway. However, clinical data to confirm this expectation are not available.
Overdose Human experience: Premarketing experience included eight reports of acute
risperidone overdosage with estimated doses ranging from 20 to 300 mg and no fatalities. In general, reported signs and symptoms were those resulting from an exaggeration of the drug's known pharmacological effects (i.e., drowsiness and sedation, tachycardia and hypotension, and extrapyramidal symptoms). One case, involving an estimated overdose of 240 mg, was associated with hyponatremia, hypokalemia, prolonged QT, and widened QRS. Another case, involving an estimated overdose of 36 mg, was associated with a seizure. Postmarketing experience includes reports of acute overdosage, with estimated doses of up to 360 mg. In general, the most frequently reported signs and symptoms are those resulting from an exaggeration of the drug's known pharmacological effects (i.e., drowsiness, sedation, tachycardia, and hypotension) (Brown, 1993) Other adverse events reported since market introduction which were temporally, (but not necessarily causally) related to risperidone overdose, include prolonged QT interval, convulsions, cardiopulmonary arrest, and rare fatality associated with multiple drug overdose.
Management of overdose: In case of acute overdosage, establish and maintain an airway and ensure adequate oxygenation and ventilation. Gastric lavage (after intubation, if patient is unconscious) and administration of activated charcoal together with a laxative should be considered. The possibility of obtundation, seizures or dystonic reaction of the head and neck
following overdose may create a risk of aspiration with induced emesis. Cardiovascular monitoring should commence immediately and should include continuous electrocardiographic monitoring to detect possible arrhythmias. If antiarrhythmic therapy is administered, disopyramide, procainamide and quinidine carry a theoretical hazard of QT-prolonging effects that might be additive to those of risperidone. Similarly, it is reasonable to expect that the alpha-blocking properties of bretylium might be additive to those of risperidone, resulting in problematic hypotension. There is no specific antidote to risperidone. Therefore, appropriate supportive measures should be instituted. The possibility of multiple drug involvement should be considered. Hypotension and circulatory collapse should be treated with appropriate measures such as intravenous fluids and/or sympathomimetic agents (epinephrine and dopamine should not be used, since beta stimulation may worsen hypotension in the setting of risperidone-induced alpha blockade). In cases of severe extrapyramidal symptoms, anticholinergic medication should be administered. Close medical supervision and monitoring should continue until the patient recovers (Brown, 1993).
2.2 Rifampin
Rifampin was first introduced in 1963 (Mcnicol et al., 1995). The rifamycins are a
group of structurally similar, complex macrocyclic antibiotics produced by Streptomyces mediterranei; rifampin is a semisynthesic derivative of this rifamycin B (Mandell and Sandle, 1991).
2.2.1 Chemical and Physical Properties
Solubility :in water, acetone, alcohol and ether
Figure 3. Structural formula of rifampin (William and Petri, 2001). 2.2.2 Pharmacodynamic Properties Mechanism of action Rifampin inhibits DNA-dependent RNA polymerase of mycobacteria and other
microorganisms by forming a stable drug-enzyme complex, leading to suppression of initiation of chain formation (but not chain elongation) in RNA synthesis. More specifically, the β-subunit of this complex enzyme is the site of action of the drug, although rifampin binds only to the holoenzyme. Nuclear RNA polymerase from a variety of eukaryotic cells does not bind rifampin, and RNA synthesis is correspondingly unaffected. While rifampin can inhibit RNA synthesis in mammalian mitochondria, considerably higher concentrations of the drug are required than for the inhibition of the bacterial enzyme. Rifampin is bactericidal for both intracellular and extracellular microorganisms (William and Petri, 2001).
Antibacterial activity
Rifampin inhibits the growth of most gram-positive bacteria as well as many gram-negative microorganisms such as Escherichia coli, Pseudomonas, indole-positive and indole-negativeProteus, and Klebsiella. Rifampin is very active against Staphylococcus aureus and coagulase negative Staphylococci; bacteriocidal concentrations range from 3 to 12 ng/ml. The drug also is highly active against Neisseria meningitidis and Haemophilus influenzae; minimal inhibitory concentrations range from 0.1 to 0.8 µg/ml. Rifampin is very inhibitory to Legionella species in cell culture and in animal models (William and Petri, 2001). Rifampin in concentrations of 0.005 to 0.2 µg/ml inhibits the growth of M. tuberculosisin vitro. Among
nontuberculous mycobacteria, M. Kansasii is inhibited by 0.25 to 1 µg/ml. The majority of stains of M. scrofulaceum, M. intracellulare, and M. avium are suppressed by concentrations of 4 µg/ml, but certain strains may be resistant to 16 µg/ml. M. fortuitum is highly resistant to the drug. Rifampin increases the in vitro activity of streptomycin and isoniazid, but not that of ethambutol, against M. tuberculosis (William and Petri, 2001). Resistance Microorganisms, including mycobacteria, may develop resistance to rifampin rapidly in vitro as a one-step process, and one of every 107 to 108 tubercle bacilli is resistant to the drug. Resistance in most cases is due to mutations between codons 507 and 553 of the polymerase rpoB gene. This also appears to be the case in vivo, and therefore the antibiotic must not be used alone in the chemotherapy of tuberculosis. When rifampin was used for eradication of the meningococcal carrier state, failures was due to the appearance of drug-resistant bacteria after treatment for as little as 2 days. Microbial resistance to rifampin is due to an alteration of the target of this drug, DNA-dependent RNA polymerase. Certain rifampin-resistance bacterial mutants have decreased virulence. Tuberculosis caused by rifampin-resistant mycobacteria has been described in patients who had not received prior chemotherapy, but this is very rare (usually less than 1%) (William and Petri, 2001). 2.2.3 Pharmacokinetic Properties Absorption
The oral administration of rifampin produces peak concentrations in plasma in 2 to 4
hours; after ingestion of 600 mg, this value is about 7 µg/ml, but there is considerable variability. Aminosalicylic acid may delay the absorption of rifampin, and adequate plasma concentrations may not be reached. If these agents are used concurrently, they should be given separately at an interval of 8 to 12 hours (William and Petri, 2001).
Food has been demonstrated to cause a 1 to 2 hours delay in the tmax and a reduction in
the Cmax and AUC of rifampin. In studies in which rifampin was geiven in combination with other antituberculosis drugs, some notable effects upon absorption and bioavailability have been reported. Rifampin dose not influence the serum concentrations of isoniazid but conflicting reports have been published on the effect of isoniazid on the former. On the other hand, para-aminosalicylic acid was found to delay the tmax of rifampin from 2 to 4 hours, reduce its Cmax
from 8.0 to 3.8 µg/ml, and decrease the AUC by approximately 50% (Boman et al., 1974). This effect was thought to be due to impairment of gastrointestinal absorption of rifampin by either alteration of the physicochemical properties of the mucosa by para-aminosalicylic acid, or a decrease in gastric emptying rate with an increased intestinal transit time. In other studies, simultaneous administration of para-aminosalicylic acid granules, thereby leading to decreased intestinal absorption of rifampin (Acocella and Conti, 1980; Boman et al., 1971). Excipients such as talcum and kaolin have also been suspected to reduce gastrointestinal absorption of rifampin. In addition, food may decrease its absorption (Siegler et al., 1974), and decreased serum concentrations of rifampin have been observed after prolonged administration (Holdiness, 1984).
Distribution
Rifampin is widely distributed with good penetration of all normal tissues including bone and serous fluid. It dose not penetrate the normal blood brain barrier, but penetrates well when there is inflammation. The tissue levels attained are about 100 times higher than the MIC for sensitive strains (Mcnicol et al., 1995). At physiological pH, only 25% of the compound of rifampin are ionized, but the molecule, as a whole is lipid soluble. The Vd (55.5 L) has been demonstrated to be independent of infusion rates in 12 tuberculosis pateint (Holdiness, 1984). Rifampin is relatively highly protein-bound. In normal subjects protein binding is approximately 80% suggested that the γ-globulin may be the main serum binding proteins (Holdiness, 1984; Chambers and Jawetz, 1998).
Rifampin is distributed throughout the body and is present in effective concentrations in
many organs and body fluids, including the CSF. This is perhaps best exemplified by the fact that the drug may impart an orange-red color to the urine, feces, saliva, sputum, tears and sweat; patients should be so warned. (William and Petri, 2001).
Metabolism
Rifampin is slowly acetylated in the liver and the unchanged drug together with
acetylrifampicin is excreted in the bile. There is a significant enterohepatic circulation of rifampin and very high concentrations are achieved in bile. Desacetylrifampicin is not reabsorbed and most of the drug is excreted in the feces in this form. It is also excreted in the urine where very high concentrations are attained. It has also been demonstrated recently that 15
to 20% of deacetylrifampicin is converted to a glucuronide, this process being commonly catalyzed by smooth endoplasmic reticulum enzymes (Holdiness, 1984).
Excretion
The half-life of rifampin varies from 1.5 to 5 hours and is increased in the presence of
hepatic dysfunction; it may be decreased in patients receiving isoniazid concurrently who are slow inactivators of this drug. The half-life of rifampin is progressively shortened by about 40% during the first 14 days of treatment, owing to induction of hepatic microsomal enzymes with acceleration of deacetylation of the drug. Up to 30% of the drug is excreted in the urine and 60% to 65% in the feces; less than half of this may be unaltered antibiotic. Adjustment of dosage is not necessary in patients with impaired renal function (William and Petri, 2001).
2.2.3 Pharmacokinetic in various pathophysiological states Renal diseases Rifampin can also be administered in full therapeutic doses to patients with severely
impaired renal function without toxic effects. Studies in the early 1970s with 300 mg rifampin found little difference between normal patients and those with severe renal insufficiency. However, when the dose was increased to 600 mg 34 to 40% increases in AUC and t1/2 were noted probably due to oversaturation of the hepatic metabolizing capacity as well as decreased renal clearance.
Reduced renal clearance of rifampin seems to be compensated by enhanced biliary
elimination, and a dose of 600 mg/day does not appear to need reduction in patients with limited renal function. Studies of peritoneal and haemodialysis patients receiving rifampin also indicate that the antibiotic is dialyzable without difficulty (Holdiness, 1984). Liver disease
Numerous studies have demonstrated increased elimination half-life in patients with
liver diseases given oral doses of 300 to 900 mg of rifampin. Following a lower dose of 450 mg, serum half-life of 2.5, 6.0 and 6.5 hours have been observed in normal, cirrhotic and hepatitis subjects, respectively. In one study slight increases in the AUC of rifampin were observed in patients with chronic liver disease compared with normal subjects, the AUC0-12 values in the 2 groups after 7 days of treatment with 600 mg of rifampin daily being 55.1 µg/ml.h (normals) and 105.2 µg/ml.h (liver disease). Associated with this was a small increase in serum t1/2 in the
chronic liver disease patients (3.2 hr vs. 1.8 hr in the normal subjects on the seventh day of treatment). Despite the longer serum t1/2 values, no marked differences in total urinary excretion were noted in the above studies, suggesting that patients with various liver diseases have the same ability to metabolize rifampin as normal individuals. However, the increased serum concentrations of rifampin could give rise to increased bilirubin levels as a result of competition for common biliary excretion mechanisms. Thus in the presence of severe hepatic disease, there may be a need to reduce the dosage of rifampin and monitor serum concentrations in order to avoid the occurrence of hyperbilirubinaemia (Holdiness, 1984).
Infants and children Reduced serum concentrations of rifampin in comparison with adults have been noted in
neonates and children up to 18 months of age given equivalent doses in terms of mg/kg bodyweight. Mean peak serum concentrations of 3.5 to 4.2, 7.1 and 9.6 to 12.0 µg/ml after preprandial administration of single rifampin doses of 10, 15 and 20 mg/kg bodyweight, respectively have been recorded in children. Peak serum concentrations of rifampin in children were found to be approximately one-third to one-tenth those of adults given a similar dose based on bodyweight; this difference is possibly due to the large total body compartments in infants (Holdiness, 1984).
In new born less than 3 days of age, peak serum concentrations after a 10 mg/kg dose
were reached up to 8 hours after dosing and were followed by comparatively slow elimination. This is possibly due to the undeveloped hepatic capacity for the drug, and a high gastric pH. Following repeated administration of dose of 10 mg/kg in newborns, accumulation of the drug has been noted. A study of the urinary excretion of rifampin in newborns (aged less than 3 days) and young children (age 4 to 18 months) given doses of 10 mg/kg showed that 37% of the dose was recovered in urine in the first 12 hours in the newborns compared with 2.5% of the older children (Holdiness, 1984).
Elderly patients Recently, the pharmacokinetic of rifampin have been studied in 6 elderly individuals
(age 78 to 95 years) after single oral doses of 10 mg/kg. The Cmax and t1/2 of rifampin were 8.83 ± 1.72 µg/ml and 4.09 ± 2.59 hours, respectively, which are comparable to those reported in younger adults. The same also applies to the Cmax (1.93 ± 0.53 µg/ml) and the t1/2 (4.65 ± 2.61
hr) values of desacetylrifampicin. However, the renal clearance of rifampin (7.5 ± 3.6 ml/min) and desacetylrifampicin (14.6 ± 2.7 ml/min) during a 24-hour period were lower than those observed in younger individuals (rifampin, 30 ± 7.6 ml/min; desacetylrifampicin, 22.5 ± 10 ml/min). The authors suggested that since the drug is eliminated via the liver to such an extent that serum concentrations are the same as in younger adults, for therapeutic purposes the metabolism of rifampin may be globally considered as unaltered in elderly patients (Holdiness, 1984).
Pregnancy There is no convincing evidence of teratogenicity in the human but high doses are
teratogenic in rats and mice. It was formerly recommended that rifampin should be avoided during the first 3 months of pregnancy, but in the absence of firm evidence of teratogenicity in humans this recommendation has been abandoned. Particularly when disease is extensive or the patient is ill, it is generally agreed that active tuberculosis is a much more serious threat to the mother and fetus than the use of rifampin, which is an important component of the most effective antituberculosis regimens. Rifampin is excreted in breast milk. This dose not appears to be associated with clinically important problems and is not a contraindication to breast feeding (Mcnicol et al., 1995). 2.2.4Adverse reactions
Rifampin generally is well tolerated. When given in usual doses, fewer than 4% of
patients with tuberculosis have significant adverse reaction; the most common are rash (0.8%), fever (0.5%) and nausea and vomiting (1.5%). Rarely, hepatitis and deaths due to liver failure have been observed in patients who received other hepatotoxic agents in addition to rifampin or who had preexisting liver disease. Hepatitis from rifampin rarely occurs in patients with normal hepatic function; likewise, the combination of isoniazid and rifampin appears generally safe in such patients. However, chronic liver disease, alcoholism and old age appear to increase the incidence of severe hepatic problems when rifampin is given alone or concurrently with isoniazid (William and Petri, 2001).
Administration of rifampin on an intermittent schedule (less than twice weekly) and/or
daily doses of 1,200 mg or greater is associated with frequent side effects, and the drug should not be used in this manner. A flu-like syndrome with fever, chill and myalgias develops in 20%
of patients who are treated. The syndrome also may include eosinophillia, interstitial nephritis, acute tubular necrosis, thrombocytopenia, hemolytic anemia and shock (William and Petri, 2001).
Because rifampin is a potent inducer of hepatic microsomal enzymes, its administration
results in a decreased half-life for a number of compound, including HIV protease and nonnucleoside reverse transcriptase inhibitors, prednisone, digitoxin, digoxin, quinidine, disopyramide, mexiletine, tocainide, ketoconazole, propranolol, metoprolol, clofibrate, verapamil, methadone, cyclosporine, corticosteroids, oral anticoagulants, theophylline, barbiturates, oral contraceptives, halothane, fluconazole and the sulfonylureas, The significant interaction between rifampin and oral anticoagulants of the coumarin about 5 to 8 days after rifampin administration is started and persists for 5 to 7 days after it is stoped. The ability of rifampin to enhance the catabolism of a variety of steroids leads to the decreased the effectiveness of oral contraceptives. The increased metabolism of methadone has led to reports of precipitation of withdrawal syndromes. Rifampin may reduce bleary excretion of contrast media used for visualization of the gallbladder (William and Petri, 2001). 2.2.5 Clinical uses Mycobacterial infections Rifampin, usually 600 mg/day (10 mg/kg/day) orally, is administered together with
INH, ethambutal, or another antituberculous drug in order to prevent emergence of drug-resistant mycobacteria. In some short-course therapies, 600 mg of rifampin is given twice weekly. Rifampin is also effective in some atypical mycobacterial infections and in leprosy when used together with a sulfone. Rifampin is an alternative to INH prophylaxis for patients who are unable to take INH or who have had close contact with a case of active tuberculosis caused by an INH-resistant, rifampin-susceptible strain (Chambers and Jawetz, 1998).
Other indications
Rifampin is used in a variety of other clinical situations. An oral dosage of 600 mg
twice daily for 2 days can eliminate meningococcal carriage. Rifampin, 20 mg/kg/day for 4 days, is used as prophylaxis in contacts of children with Haemophilus influenzae type b disease. Rifampin combined with a second agent is used to eradicate staphylococcal carriage. Rifampin combination therapy is also indicated for treatment of serious staphylococcal infections such as osteomyelitis and prosthetic valve endocarditis. Rifampin has been recommended also for use in
combination with ceftriaxone or vancomycin in treatment of meningitis caused by highly penicillin-resistant strains of pneumococci (Chambers and Jawetz, 1998). 2.2.6 Drug Interactions
Rifampin is used clinically in the treatment of tuberculosis, usually being administered
for 6 to 12 months together with other antituberculosis agents or additional medications for an accompanying disease. It is a potent inducer of drug metabolism in humans and has been shown to produce a proliferation of smooth endoplasmic reticulum and to increase the cytochrome P450 content of human liver. There is a remarkable selectivity in the enzyme induction by rifampin and not every drug metabolized by oxidation will be affectd (Venkatesan, 1992).
Oral anticoagulants
One of the first reported rifampin interaction was with oral anticoagulants. Several
groups of workers noticed that patients on long-term anticoagulants require an increase in the dose when rifampin is coadministered.
O’ Reilly (1974), who measured prothrombin time and plasma warfarin concentrations
in 10 male volunteers after single oral and intravenous dose of warfarin 1.5 mg/kg both before and during rifampin treatment, observed a highly significant decrease in the mean areas under the prothrombin time-time curve and a corresponding decrease in plasma warfarin concentrations. That there was no significant alteration in the absorption of the anticoagulant by rifampin suggests an induction of warfarin metabolizing enzymes.
In a subsequent study (1975), the same author administered warfarin 7.5 to 10 mg
together with rifampin 600 mg daily to 8 volunteers for 21 days, and noted a highly significant devrease of hypoprothrombinaemic effect and plasma warfarin concentreations associated with increased excretion of warfarin metabolites in urine and stool for the last 10 days of the study. Rifampin withdrawal decreased the warfarin requirements by 50 to 60% (Venkatesan, 1992). Heimark
et al. (1987) have shown that the reduction in hypoprothrombinaemic respone
of warfarin by rifampin is due to increased clearance of both warfarin enantiomers, thereby ruling out any regioselectivity or stereoselectivity of warfarin hydroxylating microsomal enzymes induced by rifampin. A need for increased doses of acenocoumarol and phenprocoumon during concomitant administration of rifampin has also been reported.
In cases of simultaneous rifampin and anticoagulant therapy, the dosage of the latter
should be adjusted on the basis of prothrombin time, which must be monitored especially when
oral anticoagulant therapy is either initiated or terminated. In any case, the treatment of patients with anticoagulants is a highly individualized matter (Venkatesan, 1992). Cardioactive agents Digoxin Gault et al. (1984) described 2 dialysis-dependent patients who required substantial increases (34 to 100%) in digoxin doses to maintain therapeutic digoxin concentrations after the commencement of rifampin 300 to 600 mg/day. When rifampin therapy was stopped, therapeutic concentrations of digoxin were obtained with about 50% of the dose required previously.
The serum digoxin concentration of a patient with atrial fibrillation decreased from 2.9
to 1.7 mg/l 4 days after initiation of rifampin 600 mg/day. Further reductions occurred despite increasing the digoxin dose, while stopping rifampin therapy (and reducing of the digoxin dose) resulted in serum digoxin concentrations of 1.6 and 2.6 mg/l at 8 and 15 days after rifampin therapy (Bussey et al., 1984). Greiner
et al. (1999) suggested that the AUC of oral digoxin was significantly lower
during rifampin treatment. Renal clearance and half-life of digoxin were not altered by rifampin. Rifampin treatment increased intestinal P-glycoprotein content 3.5 ± 2.1 fold, which correlated with the AUC after oral digoxin. P-glycoprotein is a determinant of the disposition of digoxin Concomitant administration of rifampin reduced digoxin plasma concentration substantially after oral administration.
Quinidine
A patient who responded well to quinidine 200 mg orally for syncope and palpitations
associated with ventricular dysarrhythmia had a relapse within 1 week of initiation of therapy with rifampin 600 mg/day concurrently with ethambutol for coexistent tuberculosis. Despite increased quinidine dosage the peak plasma quinidine concentration decreased from 5 to 1 mg/L. The patient had therapeutic quinidine concentrations 1 week after rifampin was replaced with isoniazid and the quinidine dose was increased from 1,200 to 1,600 mg/day. The AUC for quinidine was reduced by 4 to 6 fold, while its t1/2 was enhanced 3 to 6 folds with concurrent oral administration of rifampin to 8 volunteers receiving quinidine sulphate 6 mg/kg either intravenously or orally (Venkatesan, 1992).
Verapamil
A rifampin-verapamil interaction has been reported in a 67-year-old patient with
pulmonary tuberculosis treated with rifampin and supraventricular arrhythmia uncontrolled with verapamil. A 4-fold increase in serum verapamil concentration after rifampin was stopped, appeared to control the supraventricular arrhythmia (Barbarash, 1985). Fromm
et al. (1996) observed that rifampin increased the systemic clearance of the
active S-verapamil 1.3 fold. In contrast, rifampin increased the appearent oral clearance of S-verapamil 32-fold and decreased its bioavailability 25 fold. Rifampin altered the pharmacokinetics and the pharmacological effects of verapamil to a much greater extent after oral administration compared with intravenous administration.
Propafenone et al. (2000) suggested that co-administration of rifampin did not significantly
alter the pharmacokinectic parameters of propafenone, N-desalkylpropafenone, or propafenone glucuronide after intravenous administration; only the AUC and Ke of 5-hydroxypropafenone gave a difference. The effect of induction on pharmacokinetics of oral propafenone and its metabolites was significant. Bioavailability of propafenone decreased 87% in extensive metabolizers during induction, and correspondingly maximum QRS prolongation decreased by two thirds. Clearance of N-desalkylpropafenone, its conjugates, and propafenone glucuronide were enhanced significantly by rifampin, indicating substantial enzyme induction. The cumulative urinary excretion of propafenone and its metatolites decreased during induction with rifampin. It is interesting that pretreatment with rifampin hanged stereoselective phase 2 metabolism by increasing R/S-propafenone glucuronide concentration ratios both after intravenous and after oral propafenone. Rifampin induced both phase 1 metabolism (N- desalkylation) and phase 2 metabolism (glucuronidation) of oral propafenone, resulting in a clinically relevant pharmacokinetic and pharmacodynamic drug interaction in the elderly. Oral contraceptives Barditch-Crovo et al. (1999) showed that, the 14 days administration of 600 mg
rifampin daily (the recommended adult dose) produced a significant reduction in ethinyl estradial trough concentrations, AUC, Cmax, and plasma t1/2 and a significant increase in Cl/F. Rifampin significantly reduced norethindrone trough levels, AUC, Cmax, and plasma t1/2 and a significant increase in Cl/F.
A molecular basis has been reported for the rifampin-oral contraceptive steroid
interactions. Guengerich (1988) and Combalbert et al., (1989) showed that rifampin induces a human liver cytochrome P450 which is a product of the CYP 3A gene subfamily. The isozyme (CYP 3A3) is one of the major forms involved in the 2-hydroxylation of ethinyloestradiol.
It is imperative to counsel woman who will receive oral contraceptives and rifampin
concurrently. As rifampin clearly affects both estrogen and progesterone components of combined contraceptive steroids, no oral preparation is free from interaction. Since there are wide interindividual variations in response to rifampin and it is usually given for a relatively short time, oral contraceptive steroids should not be given to woman taking rifampin and alternative measures should be tried (Venkatesan, 1992).
Glucocorticoids
Prolonged administrationof rifampin increases the metabolism of many steroids,
including cortisol and prednisolone. An increase in cortisone acetate replacement therapy from 50 to 100 mg/day was required when rifampin 450 to 600 mg/day was given simultaneously to patients with Addison’s disease. Patients with tuberculosis pericarditis nephritic syndrome or renal allografts also require increased glucocorticoid doses during concurrent administration of rifampin (Venkatesan, 1992). Lee
et al. (1993) have studied the pharmacokinetic of prednisolone caused by co-
administration or discontinuation of rifampin in groups of 3 patients over a 1 month period of rifampin co-treatment or after its withdrawal, revealed significant changes in the AUC, the total clearance, the non-renal clearance and the half-life. The changes in the pharmacokinetic parameters reached a 1.5 to 2 fold plateau after 2 weeks and the half-maximal effect was attained within 5 days. Neither the Vd nor the protein binding of prednisolone was significantly altered.
Hypoglycaemics Tolbutamide Syvalathi et al. (1974) observed a decrease in serum tolbutamide concentrations in
tubercular patients who were receiving oral tolbutamide in conjunction with rifampin. In a subsequent study by the same group (Syvalathi et al., 1975), 9 patients with tuberculosis showed altered pharmacokinetics of the antidiabetic agent in respionse to intravenous dose of tolbutamide 1 g 4 weeks after starting therapy with rifampin 450 to 600 mg/day. The t1/2 of
tolbutamide declined by 43 and 41% at 180 and 360 min, respectively, after concomitant rifampin therapy.
Chlorpropamide
Diabetic control is poorer in patients on chlorpropamide during rifampin co-
administration. A 62 year old patient with diabetes required an increase in his daily dosage from chlorpropamide 250 to 400 mg when rifampin 600 mg/day was introduced as part of a tuberculosis regimen (Self and Morris, 1980).
Repaglinide
Rifampin decreased the total AUC of repaglinide by 57% and Cmax of repaglinide by
41%. The elimination t1/2 of repaglinide was shortened from 1.5 to 1.1 hours. The blood glucose decremental AUC(0-3) was reduced from 0.94 to 0.23 mmol/L.h, and the maximum decrease in blood glucose concentration from 1.6 to 1.0 mmol/L by rifampin. Rifampin considerably decreases the plasma concentrations of repaglinide and also reduces its effects. This interaction is probably caused by induction of the CYP 3A4-mediated metabolism of repaglinide (Niemi et al., 2000).
Glyburide and Glipizide
Rifampin decreased the AUC of glyburide by 39% and the Cmax by 22%. The
elimination t1/2 of glyburide was shortened from 2.0 to 1.7 hours by rifampin. The blood glucose decremental AUC(0-7) and the maximum decrease in the blood glucose concentration were decreased by 44% and 36%, respectively, by rifampin. Rifampin decreased the AUC of glipizide by 22% and shortened its t1/2 from 3.0 to 1.9 hours. No statistically significant differences in the blood glucose concentrations. Rifampin moderately decreased the plasma concentrations and effects of glyburide but had only a slight effect on glipizide. The mechanism underlying the interaction between rifampin and glyburide is probably induction of either CYP 2C9 or P-glycoprotein or both. Induction of CYP 2C9 would explain the increased systemic elimination of glipizide. It is probable that the blood glucose-lowering effect of glyburide is reduced during concomitant treatment with rifampin (Niemi et al., 2001).
Methadone et al. (1975) reported the occurrence of narcotic withdrawal symptoms in a
group of patients on a methadone maintenance regimen who were also given rifampin for
coexistent tuberculosis. The serum concentrations of methadone were significantly lower than those seen when rifampin was stopped.
Morphine
The potent analgesic morphine is metaboloized by more than one UDP-
glucuronosyltransferases (UGT) to the active metabolite morphine-6-glucuronide and to morphine-3-glucuronide, which is devoid of analgesic activity. Fromm et al. (1997) investigated the influence of the potent enzyme inducer rifampin on analgesic effects and pharmacokinetics of morphine, which is primarily, eliminated by phase 2 metabolism. The results showed that, the AUC of morphine and the Cmax were considerably reduced during co-administration of rifampin. Since urinary recoveries of both morphine-3-glucuronide and morphine-6-glucuronide were also reduced during administration of rifampin, there is no evidence for a contribution of UGI induction to the observed interaction.
Immunosuppressants Cyclosporin Hebert et al. (1992) showed that rifampin not only induces the hepatic metabolism of
cyclosporine but also decreases its bioavailability to a greater extent than would be predicted by the increased metabolism. The decreased bioavailability most probably can be explained by an induction of intestinal cytochrome P 450 enzymes, which appears to be markedly greater than the induction of hepatic metabolism.
Tacrolimus Tacrolimus is subject to extensive metabolism by CYP 3A4 and is a substrate for P-
glycoprotein-mediated transport. Tacrolimus was evaluated in six healthy male volunteers. Co-administration of rifampin significantly increased tacrolimus clearance and decreased tacrolimus bioavailability. Rifampin appears to induce both intestinal and hepatic metabolism of tacrolimus, most likely through induction of CYP 3A4 and P-glycoprotein in the liver and small bowel (Hebert et al., 1999; Chenhsu et al., 2000).
Antifungal Agents Ketoconazole Doble et al. (1988) observed the peak plasma ketoconazole levels and the AUC for
ketoconazole were significantly diminished when taken in conjuction with rifampin.
Itraconazole Jaruratanasirikul and Sriwiriyajan (1998) have found that itraconazole concentration
were higher when it was administered alone than when it was administered with rifampin. Co-administration of rifampin results in undetectable levels of itraconazole in all subjects except one normal volunteer. The mean AUC0-24 was 0.39 vs 3.98 µg/ml.hr with and without rifampin was approximately 88% compared with itraconazole was administered alone. Rifampin has a very strong inducing effect on the metabolism of itraconazole, so that these two drugs should not be administered concomitantly.
Antituberculosis drugs Rifampin has no effect on either the metabolism or excretion of pyrazinamide. The
pharmacokinetic properties of both drugs were not altered significantly whenrifampicin and isoniazid were administered in conjunction. Although some clinical studies and case reports suggest that the combination of rifampin and isoniazid may be more hepatotoxic than either drug alone, Holdiness (1984) has emphatically reported that the vast majority of individuals receiving both drugs together do not develop clinically evident synergistic hepatotoxicity.
Drug for human immunodeficiency virus (HIV) Infection Zidovudine Fourteen days of co-administration with rifampin significantly increased zidovudine
oral clearance (89%) and formation clearances to 5’-glucuronosyl zidovudine metabolite (100%) and 3’-amino metabolite (82%). Correspondingly, there were decreases in maximum plasma concentration (43%), AUC (47%) and urine recovery (37%) of zidovudine. After stopping rifampin for 14 days, values of these pharmacokinetic parameters returned to within 26% of baseline. Rifampin induced zidovudine glucuronidation and amination pathways resulting in decreased plasma and urine exposures to zidovudine. The magnitude of the residual inductive effect was minimal at 14 days after stopping rifampin (Gallicano et al., Burger et al., 1993).
Protease Inhibitors Saquinavir is extensively metabolized by cytochrome P450 enzymes, primarily CYP
3A4. In a premarketing clinical study of 12 healthy volunteers, a dose of saquinavir, 600 mg, was given 3 times daily concurrently with rifampin, 600 mg/day. At steady state concentrations,
a dramatic decrease of about 80% in both AUC and Cmax of saquinavir was observed. Based on the significance ofthis study, concomitant administration of saquinavir with rifampin should be avoided. Studies of this interaction with a new formulation of saquinavir, which has enhanced bioavailability, are being conducted (Strayhorn et al., 1997).
Since ritonavir and indinavir are both primarily metabolized by CYP 3A4, induction of
metabolism by rifampin is probable. Healthy volunteers were given either concomitant rifampin, 600 mg/day, and indinavir, 800 mg every 8 hours, or indinavir alone. Rifampin use resulted in a drastic 92% decrease in indinavir AUC. Rifampin induction of ritonavir metabolism appears to be less significant. Administration of ritronavir, 500 mg twice daily, with rifampin 600 or 300 mg/day, resulted in a decrease inritonavir AUC by 35% and Cmax by 25%. A newer protease inhibitor, nelfinavir, is also primarily metabolized by CYP 3A4. Rifampin administration has resulted in a 3 to 11 fold increase in nelfinavir oral clearance in 12 healthy volunteers (Strayhorn, 1997; Moreno et al., 2001).
The co-administration of amprenavir and rifampin resulted in significant changes in
the pharmacokinetics of amprenavir, including an 82% decrease in the AUC and an increase of grater than 5 fold in amprenavir Cl/F. This most likely reflects induction of hepatic and intestinal CYP 3A4 by rifampin, and possibly enhancement of p-glycoprotein transport, resulting in an increase in clearance of amprenavir (Polk et al., 2001).
Delavirdine Borin et al. (1997) studied the effect of rifampin on the pharmacokinetic of delavirdine.
In the rifampin group, oral clearance of delavirdine increased nearly 27 fold, and plasma through concentrations of delavirdine were almost negligible after 2 weeks of concomitant therapy. Based on the results of this study, concurrent administration of delavirdine with rifampin should be avoided.
Psychotropic Agents Benzodiazepines Backman et al. (1996) studied 10 patients receiving rifampin, 600 mg/day, or a placebo
for 5 days. Midazolam, 15 mg/day orally, was introduce on day 6. Midazolam values for Cmax decreased by 94%, and for AUC by 96%; the elimination half-life was 40% compared with the control value. The mechanism of this interaction is postulated to be due to enzymatic induction in the gut wall, since AUC decreased much more than the half-life.
Rifampin also has a marked pharmacokinetic and pharmacodynamic effect on
triazolam. In a double-blind, randomized, cross-over study of 10 healthy volunteers, use of rifampin, 600 mg/day, for 5 days reduced triazolam AUC by 95% and Cmax by 88%. Consistent with the drastic reduction in serum concentrations, the patients experienced virtually no pharmacologic effect from the single 0.5 mg oral dose of triazolam as tested by psychomotor performance (Villikka et al., 1997).
Zolpidem Five day pretreatment with rifampin acused a great reduction in the plasma
concentrations and effects of zolpidem. After rifampin, the total AUC of zolpidem averaged only 27%, the Cmax of zolpidem was decreased by 58% and the t1/2 was shortened from 2.5 ± 0.5 to 1.6 ± 0.1 hours by rifampin. The effects of zolpidem are considerably reduced by rifampin because of enhanced metabolism of zolpidem (Villikka et al., 1997).
Antimalarial Drugs Quinine Wanwimolruk et al. (1995) studied the effect of rifampin pretreatment on the
pharmacokinetics of quinine after a single oral dose (60 mg quinine sulphate) in nine healthy young Thai male volunteers. The mean clearance (Cl/F) of quinine co-administered with rifampin was significantly greater than that of quinine alone. The mean difference in clearance from the control treatment was 0.73 l/h/kg, with 95% confidence interval (C.I.) of 0.48 to 0.98. The unbound clearance (Clu/F) of quinine, which reflects the activity of the drug metabolizing enzymes was considerably greater (6.9-fold) in subjects when rifampin was administered with quinine than that of quinine alone. The mean elimination half-life of quinine when co-administered with rifampin was significantly shorter than when quinine was given alone. These results indicate that rifampin pretreatment caused a marked increase (6.2 fold) in the clearance of quinine, possibly due to enzyme induction. The extent to which the elimination of quinine is enhanced by the concomitant administration of rifampin is likely to have important clinical consequences. Although the clinical significance of these finding is unknown, they indicate the need for caution in the administration of quinine to patients who are concurrently taking rifampin as an anti-tuberculosis medication.
Mefloquine Rititid et al. (2000) indicated that rifampin significantly decreased the AUC of
mefloquine by 68%. Cmax by 19%, and elimination t1/2 by 63%, whereas the tmax of mefloquine was unaffected. The Cl/F of mefloquine was significantly increased by 281%. After administration of rifampin, the Cmax of the carboxylic acid metabolite of mefloquine was significantly increased by 47%. Where as the t1/2 was significantly decreased by 39% and tmax by 76%. The AUC and Clearance of the mefloquine metabolite were increased by 30% and 25%, respectively, but were not significantly different from the control phase. The results indicated that rifampin reduces the plasma concentration of a single oral dose of 500 mg mefloquine by increasing metabolism of mefloquine in the liver and gut wall. The CYP 3A4 isozyme most likely plays an important role in the enhanced metabolism of mefloquine. Simultaneous use of rifampin and mefloquine should be avoided to optimize the therapeutic efficacy of mefloquine and prevent the risk Plasmodium falciparum resistance in malarial treatment.
Others Chloramphenicol Prober (1985) reported decrease of 86.5 and 63.8% in serum concentrations of
chloramphenicol in 2 children treated with intravenous chloramphenicol and rifampin concomitantly. Kelly et al. (1988) also found chloramphenicol-rifampin interactions in children. Although additional studies are required to validate this interaction, serum concentrations of chloramphenicol may be tested as a precautionary measure when this drug is administered concomitantly with rifampin.
Theophylline Gillum et al. (1996) observed that rifampin treatment, 300 mg/day for 14 days, results
in a significant increase in clearance of theophylline and the mean AUC for theophylline decreased by 27%.
Ondansetron The mean total AUC of orally administered ondansetron after rifampin pretreatment
was reduced by about 50% and the elimination t1/2 by 38% the bioavailability of oral ondansetron was reduced from 60% to 40% by rifampin. The Cl of intravenous ondansetron was increased 83% by rifampin. Rifampin reduced the t1/2 of intravenously administered ondansetron
by 46% and AUC by 48%. Rifampin considerably decreased the plasma concentrations of ondansetron after both oral and intravenous administration. The interaction is most likely the result of induction of the CYP 3A4-mediated metabolism of ondasetron (Villikka et al., 1997).
Trimethoprim and Sulfamethoxazole Statistically significant, 47 and 23% decreases in trimethoprim and sulfamethoxazole
mean AUC(0-24), respectively, were observed after administration of rifampin. N-Acetyl-sulfamethoxazole profiles without and with rifampin were similar. The steady-state AUC(0-24) metabolite/parent drug ratio increased by 32% with rifampin administration. The results show that rifampin reduces profiles of trimethoprim and sulfamethoxazole in serum of HIV-infected patients (Ribera et al., 2001).
Lamotrigine Rifampin was able to reduce the AUC of lamotrigine representing a measure of the
total body load of drug, and to increased both the Cl/F of lamotrigine and the amount of lamotrigine in urine excreted as glucuronide. Additionally, co-administration of rifampin was associated with a 30% shortenting of the lamotrigine half-life. Rifampin altered pharmacokinetics of lamotrigine due to induction of the hepatic enzymes responsible of glucuronidation (Ebert et al., 2000).
Simvastatin Rifampin reduced the mean AUC of simvastatin and simvastatin acid by 87% and 93%,
respectively. The Cmax values of both simvastatin and simvastatin acid were decreased by 90% by rifampin. Rifampin had no significant effect on the tmax or t1/2 of simvastatin or simvastatin acid. Rifampin greatly decreased the plasma concentrations of both simvastatin and simvastatin acid. Because the elimination half-life of simvastatin was not affected by rifampin, induction of the CYP3A4-mediated first-pass metabolism of simvastatin in the intestinal and the liver probably explains this interaction (Kyrklund et al., 2000).
Fexofenadine Hamman et al. (2001) showed that a significant increase in the oral clearance of
fexofenadine after rifampin treatment. The Cmax of fexofenadine was also significantly reduced by rifampin treatment, tmax and fraction unbound of fexofenadine showed no significant difference between control and treatment. The amount of azacyclonol, a CYP3A4 mediated
metabolite of fexofenadine, eliminated renally increased on average 2-fold after rifampin dosing; however, this pathway accouted for less than 0.5% of the dose. This study showed that rifampin effectively increased fexofenadine oral clearance. They concluded that the cause of the increased oral clearance of fexofenadine is a reduced bioavailability caused by induction of intestinal P-glycoprotein.
2.3 The cytochrome P 450 enzymes (CYP)
Drug-metabolizing enzymes are found in the endoplasmic reticulum of cells in these
tissues and are classified as microsomal enzymes. There are 2 types of drug-metabolizing enzymes: phase 1 enzymes, or mixed function oxidases, which catalyze predominantly oxidation, reduction, and hydrolysis; and phase 2 enzymes, which catalyze conjugation reactions such as glucuronidation, sulfation, and acetylation (Hunt et al., 1992).
The majority of phase 1 metabolism is catalyzed by the cytochrome P 450 enzymes
(CYP), which are heme containing, membrane-bound proteins. These enzymes, found at highest concentration in the hepatocytes, biotransform lipophilic drugs to more polar compounds that can be excreted by the kidneys. The metabolites are usually less active than the parent compound, although some drugs undergo biotransformation to pharmacologically active agents. The cytochrome P 450 proteins are embedded in the lipid bilayer of the smooth endoplasmic reticulum. An important associated protein, NADPH-cytochrome P450 reductase, is also attached to this lipid bilayer in a stoichiometry of about ten P 450 molecules to one reductase (Benet, et al., 1991). CYP are named with the root CYP followed by an Arabic number and upper case letter designating the family and subfamily, respectively. Individual CYP forms are denoted by Arabic number that follows the subfamily letter (Gonzalez and Kasper, 1990).
2.3.1 Human hepatic cytochrome P 450s (P450s)
The CYP comprise a superfamily of haemoproteins which contain a single iron
protoporphyrin IX prosthetic group. This superfamily is subdivided into families and subfamilies that are defined solely on the basis of amino acid sequence homology. To date, at least 14 CYP gene families have been identified in mammals. The mammalian CYP families can be functionally subdivided into 2 major classes, those that involve the biosynthesis of
steroids and bile acids and those that primarily metabolize xenobiotics. Three main CYP gene families, CYP 1. CYP 2 and CYP 3 are responsible for most hepatic drug metabolism. Although the CYP 1 and CYP 3 gene families are relatively simple (i.e. CYP 1A, CYP 1B and CYP 3A), the CYP 2 gene family is comprised of many subfamilies (e.g., CYP 2A, CYP 2B, CYP 2C, CYP 2D, CYP 2E, etc). These isoforms have the same oxidizing center (the haem iron), but differ by their protein structures (Lin, 2003).
For different CYP, specificity control is governed by the entry of the substrate into the
active site and the direct interaction of amino acids in the active site with the substrate. Because the interaction of substrate and mammalian CYP generally lacks absolute complementarily, substrates often bind to the enzyme active site in several different configurations, resulting in multiple metabolites with regio and stereospecificity unique to each isoform.
In general, a significant drug-drug interaction occurs only when 2 or more drugs
compete for the same enzyme and when the metabolic reaction catalyzed by this enzyme is major elimination pathway. Drug-drug Interactions can also occur when the CYP responsible for the metabolism of a drug is induced by longterm treatment with another drug. Thus, definitive assessment of role of an individual CYP in a given metabolic pathway is essential in determining and predicting the potential for drug interaction. To identify which CYP isoforms are responsible for the oxidative metabolism of drugs, a general strategy has emerged for in vitro study.
2.3.2. Mechanisms of inhibition of CYP
The mechanisms of CYP inhibition can be divided grossly into 3 categories: reversible inhibition, quasi-irreversible inhibition and irreversible inhibition. Among these, reversible inhibition is probably the most common mechanism responsible for the documented drug interactions (Halpert, 1995).
Reversible Inhibition : Many of the potent reversible CYP inhibitors are nitrogen-containing drug, including
imidazoles, pyridines and quinolines. These compounds do not only bind to the prosthetic haem iron, but also to the lipophilic region of the protein. Inhibitors that simultaneously bind to both regions are inherently more potent inhibitors. The potency of an inhibitor is determined both by its lipophilicity and by the strength of the bond between its nitrogen lone electron pair and the prosthetic haem iron. For example, both ketoconazole and cimetidine are imidazole- containing
compounds that interact with ferric CYP at its sixth axial ligand position to elicit a type II optical difference spectrum. The coordination of a strong ligand to the pentacoordinated iron, or the displacement of a weak ligand from the hexacoordinated haem by a strong ligand, gives rise to a "type II" binding spectrum. However, cimetidine is a relatively weak reversible inhibitor of CYP, an apparent result of an intrinsic low binding affinity to microsomal CYP. Similarly, fluconazole contains a triazole that binds to the prosthetic haem iron but is a weak reversible CYP inhibitor, again due mainly to its low lipophilicity.
Many antimalarial agents (such as primaquine. chloroquine. amodiaquine and
mefloquine) contain a quinoline ring and are potent reversible CYP inhibitors. However, the inhibition activity is not associated with the quinoline structure, since the pyridine nitrogen is sterically hindered. Instead, the amino group in substituents on the quinoline ring appears to be the primary determinant of the observed inhibition potency.
Quasi-Irreversible Inhibition via Metabolic Intermediate Complexation :
A large number of drugs, including methylenedioxybenzenes, alkylamines, macrolide
antibiotics and hydrazines, undergo metabolic activation by CYP enzymes to form inhibitory metabolites. These metabolites can form stable complexes with the prosthetic haem of CYP, called metabolic intermediate (Ml) complex, so that the CYP is sequestered in a functionally inactive state. Ml complexation can be reversed, and the catalytic function of ferric CYP can be restored by in vitro incubation with highly lipophilic compounds that displace the metabolic intermediate from the active site. Dissociation or displacement of the Ml complex results in the reactivation of CYP functional activity. However, in in vivo situations, the Ml complex is so stable that the CYP involved in the complex is unavailable for drug metabolism, and synthesis of new enzymes is the only mean by which activity can be restored. The nature of the Ml complexation is, therefore, considered to be quasi-irreversible (Lin, 2003).
Drug containing certain functional group can be oxidized by CYP to reactive
intermediates that cause irreversible inactivation of the enzyme prior to its release from the active site. Because metabolic activation is required for enzyme inactivation, these drugs are classified as mechanism-based inactivators or suicide substrates. The mechanism-based inactivation of CYP may result from irreversible alteration of haem or protein, or a combination of both. In general, modification of the haem group invariably inactivates the CYP, whereas
protein alteration will result in loss of catalytic activity only if essential amino acids, which are vital for substrate binding, electron transfer and oxygen activation, are modified.
2.3.3. Mechanism of induction of CYP
For many years, scientists have been trying to solve the mystery of how the cells
recognize the inducing agents and how the signal is transferred to the transcriptional machinery. With the exception of the CYP 1A1 isoform, the molecular mechanisms involved in CYP induction are still not fully understood. In the case of CYP 1A1, inducing agents bind to cytosolic polycyclic aromatic hydrocarbon (Ah) receptors and are translocated into the nucleus. The transcriptional process include a sequence of events: ligand-dependent heterodimerisation between the Ah receptor and an Ah receptor nuclear translocator, interaction of the heterodimer with a xenobiotic-responsive enhancer, transmission of the induction signal from the enhancer to a CYP 1A1 promoter, and alteration in chromatin structure. This is followed by subsequent transcription of the appropriate mRNA and translation of the corresponding proteins.
Although the phenomenon of CYP induction has been known for more than 4 decades,
only in recent years we have begun to uncover the mechanisms involved in induction. From a biological point of view, induction is an adaptive response that protects the cells from toxic xenobiotics by increasing the detoxification activity. While in most cases CYP induction is the consequence of an increase in gene transcription, some nontranscriptional mechanisms also are known to be involved.
In drug therapy, there are 2 major concerns related to CYP induction. First, induction
will result in a reduction of pharmacological effects caused by increased drug metabolism. Secondly, induction may create an undesirable imbalance between "toxification" and "detoxification". Like a double-edged sword, induction of drug metabolizing enzymes may lead to a decrease in toxicity through acceleration of detoxification, or to an increase in toxicity caused by increased formation of reactive metabolites. Depending upon the delicate balance between detoxification and activation, induction can be a beneficial or harmful response (Lin, 2003).
2.3.4 Clinical implications Inhibition
The clinical relevance of drug inhibition will depend on a number of considerations.
One of the most important considerations is the therapeutic index of the drug. Patients receiving
anticoagulants, antidepressants or cardiovascular drugs are at a much greater risk than patients receiving other kinds of drugs because of the narrow therapeutic index of these drugs. Although most interactions that can occur with these agents are manageable, usually by appropriate dosage adjustment, a few are potentially life threatening.
Clinical data showed that itraconazole and erythromycin also impair the metabolism of
terfenadine. Because CYP 3A4 represents a major CYP isoform in human liver, and because CYP 3A4 has a broad spectrum of substrate specificity, it is likely that many other drugs are capable of inhibiting terfenadine metabolism. Because of its undesirable properties, terfenadine was recently withdrawn from market or had its use restricted in several countries. Inhibition can also reduce clinical efficacy, if the drug is a prodrug requiring metabolic activation to achieve its effects and activation is blocked (Choo et al., 2000).
Reversible enzyme inhibition is transient; the normal function of CYP enzymes
continues after the inhibitor has been eliminated from the body. In contrast, the loss of enzyme activity caused by irreversible inactivation persists even after elimination of inhibitor, and denovo biosynthesis of new enzymes is the only means by which activity can be restored. Clearly, clinical and pharmacokinetic consequences of irreversible drug inhibition are quite complicated, depending on the duration and frequency of administration. The long-term effects of irreversible inhibition on CYP are yet unknown, and further studies need to address this question.
Metabolic drug interaction is usually regarded as potentially dangerous, or at least
undesirable. However, there are times when these interactions may be exploited. For example, because these 2 drugs are substrates for the same human CYP 3A4, the antifungal agent ketoconazole is used with cyclosporin, an immunosuppressive agent, to prolong the elimination of the cyclosporin. The idea is to use the relatively inexpensive ketoconazole to specifically inhibit the metabolism of the very expensive cyclosporin, thereby minimizing the cost of long-term immunosuppressive therapy.
Induction of CYP Usually, metabolites are less pharmacologically active than the parent drug and,
therefore, enzyme induction results in a reduction in pharmacological effect because of increased drug metabolism. In some cases, the metabolites formed during biotransformation may be chemically reactive, so that enzyme induction may result in increased toxicity caused by the increased production of the toxic metabolites.
Rifampicin is one of the most potent enzyme inducers known to humans. It induces
several CYP isoforms, including CYP 2C and CYP 3A. Clinical studies in healthy volunteers demonstrated a reduction in the thrombin time and a corresponding decrease in the plasma half-life of warfarin following treatment with rifampicin (Lin, 2003). Another clinically important interaction with rifampicin involves the concomitant administration of oral contraceptives, which has been reported to result in menstrual disturbance and unplanned pregnancies. The increased metabolism of both estrogenic and progesterogenic components of oral contraceptives is believed to be the underlying mechanism (Fontaine et al. 2000).
Although enzyme induction generally reduces the pharmacological effect because of
increasing of drug metabolism, sometimes the formed metabolites has the same pharmacological activity as the parent drug. Thus the clinical consequences of enzyme induction will be determined by the relative reactivity of the parent drug and the formed metabolite. During concomitant administration of inducers, increasing the drug dosage can circumvent the reduction in drug concentration. However, if dosages are increased, there is a danger of excessive accumulation of drug when the inducer is withdrawn and enzyme activity returns to normal (Lin, 2003). 2.4 P-glycoprotien (P-gp)
Numerous transporters have been characterized in the liver, kidney, intestine, and lung,
which serve diverse functions including ion, sugar, amino acid, and peptide transport as well as drug and metabolite disposition. This section focuses on one of these transporters, P-glycoprotein (P-gp), an adenosine triphosphate (ATP) dependent drug transporter that has been extensively characterized for its role in multidrug resistance in cancer chemotherapy. Expression of this protein in tumors is associated with decreased intracellular accumulation of cytotoxic drugs, thereby enhancing cell survival in the presence of otherwise cytotoxic drug levels. P-gp is promiscuous in its ability to interact with a large number of structurally and mechanistically distinct drugs, resulting in tumors that are cross-resistant to a diverse number of drugs, hence term multidrug resistance (Silverman, 2000).
One physiologic role of P-gp is to serve as a barrier to entry and as an efflux mechanism for xenobiotics and cellular metabolites. It has also been suggested that P-gp may limit intestinal drug absorption to constrain oral drug bioavailability. Since the discovery of the drug efflux activity of P-gp, numerous investigations have attempted to inhibit P-gp-mediated drug efflux with the ultimate goal of increasing the efficacy of cancer chemotherapy. Initial attempts used existing compound: however, because of undesirable pharmacologic activities or limited success, ongoing investigations are using novel agents that are more specific and potent (Silverman, 2000). P-gp is a member of the large, ATP-binding cassette (ABC) transporter family. Hundreds of these traffic ATPases have been identified in bacteria, plants, fungi, and animal cells and are important in the movement of a large number of nutrients and waste products. ABC transporters transport virtually any class of substrate, including ions, sugars, amino acids, peptides, and polysaccharides. These membrane transporters typically have four domains: two have up to six membrane-spanning regions and two, locate at the cytoplasmic surface, bind ATP and couple its hydrolysis to substrate transport. Most notably in prokaryotes, these individual domains are encoded by separate genes; however, in mammals, they are often encoded by a large single gene.
Sequence analysis revealed that P-gp is made up of 1,280 amino acids with roughly
bilateral symmetry; the amino and carboxy halves of the protein each have six transmembrane domains and an ATP-binding region. This structural model for P-gp has been investigated using antibody mapping, site-directed mutagenesis, and biochemical analysis. The secondary structure of P-gp was found to contain 32% α-helix, 26% β-sheet, 29% turns, and 13% random coil; no significant alterations in these parameters occurred upon binding of verapamil, ATP, or a nonhydrolyzable ATP analogue (Silverman, 2000). 2.4.1 Function of P- glycoprotien
Unlike typical ABC transporters, which have a narrow, usually single, substrate range,
a defining characteristic of P-gp is its ability to transport literally hundreds of compounds. Increased expression of P-gp is associated with the multidrug-resistant phenotype in which cells become cross resistant to structurally and mechanistically distinct cytotoxic drugs. Demonstration that this protein is responsible for this phenotype comes most clearly from gene transfer experiments. Transfection of high molecular weight DNA isolated from drug-resistant
cells confers a multidrug-resistant phenotype to previously drug-sensitive cells. Similarly, transfection of either the murine mdrl or human MDR1 cDNAs into drug-sensitive cells also results in a 200-fold increase in resistance to daunomycin and cross resistance to adriamycin, colchicine, vincristine, and vinblastine. The level of drug resistance in MDRI-transfected cells correlates with the expression of P-gp. Thus, transfer of the cDNA-encoding P-gp is in itself sufficient to confer a drug-resistant phenotype upon drug-resistant cells (Silverman, 2000). 2.4.2 Role of P- glycoprotien in drug absorption and disposition
The role of P-gp in cancer chemotherapy is well established; however, recognition of
its role in drug absorption, disposition, and potential drug interactions is more recent. P-gp can affect drug levels in several ways. For example, P-gp is expressed on the biliary canalicular membrane of hepatocytes facilitating the excretion of drugs, metabolites, and xenobiotics into the bile. Similarly, because of its expression on the apical surface of intestinal villus enterocytes, P-gp is well situated to affect the absorption of substrate drugs. A role for P-gp in detoxification pathways and limiting uptake of drugs and xenobiotics has long been postulated and has recently been substantiated by experimental observations using both in vitro and in vivo model systems.
A major contribution among the many models used to investigate the role of P-gp in
drug absorption and disposition was the development of knockout mice in which the mdr1a alone or both the mdr1a and mdr1b genes have been functionally disrupted by homologous recombination. Using these mice, several studies have demonstrated a clear role for P-gp in the pharmacokinetics of drugs such as vinblastine, taxol, digoxin, and several cationic compounds. Mice lacking mdr1a exhibit reduced fecal elimination of vinblastine, digoxin, taxol, tri-n-butylmethylammonium (TbuMA), and azido-procainamide methoiodide (APM). These mice also exhibit increased accumulation of drugs in the liver, brain, and gall bladder, tissues, which normally express P-gp. The serum terminal half-life of intravenously administered vinblastine was longer in the knockout mice than in wild-type animals, 3.6 versus 2.1 hours, respectively, and the fecal elimination was reduced from 20% to 25%. Vinblastine also accumulated in the brain, heart, and liver of the mdr la-deficient animals. Similarly, reduced fecal and intestinal elimination and increased tissue accumulation of digoxin was observed in these animals. Thus, P-gp contributes substantially to the elimination of substrate drugs through both hepatic and intestinal secretion.
mdr1a knockout mice have also been used to demonstrate a clear role of P-gp in
drug absorption. Increased bioavailability and altered tissue distribution was observed for paclitaxel, loperamide, vinblastine, ivermectin, cyclosporin A (CsA), human immunodeficiency virus (HIV) protease inhibitors, TBuMA and APM. Marked increases in accumulation of these drugs were observed in the brain, liver, intestine, and other tissues of the knockout versus wild-type animals. Oral administration of loperamide resulted in plasma levels that were two to three times higher in mdr1a knockout mice compared to wild-type mice. The lethal dose of loperamide in wild-type mice was approximately 80 mg/kg, whereas, in the mcdr1a-deficient mice, the lethal dose was 10 mg/kg. The knockout mice had clear central opiate effects, which were absent in the wild-type mice because of the low amount of this drug that normally crosses the blood-brain barrier. Similarly, a six-fold increase in the area under the plasma concentration versus time curve (AUC) and a 11 fold increase in Cmax for orally administered paclitaxel was observed in the mcdr1a-deficient mice compared to the control animals. Consequently, the oral bioavailability of paclitaxel increased from 11% in wild-type mice to 35% in the knockout animals. Co-administration of the P-gp inhibitors PSC 833 or CsA with paclitaxel in wild-type animals resulted in a 10-fold increase in AUC, further supporting a role for P-gp in oral drug absorption. These data also clearly demonstrate the consequences of inhibition of P-gp on the pharmacokinetics of a co-administered drug. This increase is greater than that observed in the knockout mice and is likely due to inhibition of CYP3A in the intestine and liver, suggesting a combined role of P-gp and CYP 3A in limiting oral bioavailability of substrate drugs. Kim
et al (1998) recently observed that P-gp also limits the oral bioavailability of the
HIV protease Inhibitors indinavir, nelfinavir, and saquinavir, which suggests more effective treatment of this disease may be achieved by coadministration of a P-gp inhibitor with these agents. Administration of these protease inhibitors to mdr1a-deficient mice resulted in two to five fold higher plasma concentrations and a seven- to 36-fold increased brain accumulation of the drugs. These authors suggest that targeted inhibition of P-gp would result in higher protease inhibitor concentrations and more effective therapy. Hunter et al (1993) used immunofluorescence with the MRK16 antibody to demonstrate apical expression of P-gp in these cells. Using specialized dual-chamber tissue culture dishes, these authors observed transporter-mediated, directional, and saturable secretion of vinblastine from the basolateral toward the apical side of Caco-2 monolayers. Several P-gp
modulators such as verapamil, MRK16, taxotere, 1,9-dideoxyforskolin, and nifedipine inhibited this transport. Furthermore, this inhibition led to a dose-dependent increase in vinblastine absorptive flux. Similarly, P-gp mediated time and concentration dependent polarized efflux of CsA was observed in Caco-2 cells and was suggested to be a key physiologic determinant of CsA oral bioavailability. These data provided early support for the hypothesis that P-gp, located at the tip of the intestinal villus, is a barrier for drug absorption.
Intestinal absorption of β-adrenoreceptor antagonists (β-blockers) is variable and has
been shown to be somewhat dependent on lipophilicity. Absorption of one such -β blockers, celiprolol, increases at high doses and is nonlinear in humans. Studies with Caco-2 cells show that celiprolol is actively and saturably effluxed but passively and nonsaturably absorbed, suggesting the involvement of an active transport mechanism. Celiprolol basolateral to apical (secretory) transport was inhibited by the P-gp substrate vinblastine as well as the P-gp reversal agents verapamil and quinidine. These data suggest that this transporter is involved in celiprolol absorption. Similarly, basolateral to apical transport of acebutolol is two-fold greater than in the reverse direction. Intestinal absorption of acebutolol is increased 2.6 fold in the presence of CsA. Combined, these data as well as numerous additional investigations clearly demonstrate that P-gp is one factor important in determining drug absorption and elimination.
Recent studies have demonstrated that interaction between intestinal drug metabolism
by CYP 3A and P-gp-mediated transport may contribute to the poor oral bioavailability and high interpatient and intrapatient variability in absorption of drugs. The liver has been classically viewed as the primary site of drug metabolism; recently, however, it has been recognized that a significant amount of drug metabolism occurs in the intestine and is mediated by CYP 3A. Although the intestine does not quantitatively have as much CYP 3A as the liver, the enzyme is located in the differentiated villus cells, which are the site of drug absorption. Greater than 50% of clinically important drugs are metabolized by CYP 3A; thus, its location in the intestine suggests a critical role for it in oral drug bioavailability. Recently, a striking overlap between the substrates for P-gp and CYP 3A family members has been observed. Simultaneous expression of these proteins in the intestine suggests complementary roles that may limit drug absorption and increase disposition. Another potential function of P-gp in the intestine may be to transport compounds back into the lumen. This would establish a cyclic pathway for drugs as they transit the intestine, thereby increasing the exposure time of drugs to
drug-metabolizing enzymes (e.g., CYP 3A) to act. The cooperative nature of CYP 3A and P-gp presents a unique opportunity to affect substrate absorption and a significant potential for drug interactions (Silverman, 2000).
2.4.3 Drug interactions with P-glycoprotein
P-glycoprotein and the Antifungal Agents
Much of the data on the effects of the antifungal agent on P-glycoprotein function comes from in vitro cell culture models of directional drug transport or ex vivo models of intestinal drug secretion. The results obtained seem to vary with the model used, making a definitive conclusion difficult. In addition, the in vivo significance of the IC50 values for inhibition of in vitro drug transport is not clear, because estimates of P-glycoprotein-available concentrations of substrates and inhibitors in vivo are not established (Venkatakrishnan et al., 2000). In vitro transport studies suggest that ketoconazole is not a P-glycoprotein substrate, although in vivo studies in mdr1a (-/-) knockout mice have yielded conflicting results. Ketoconazole is an inhibitor of P-glycoprotein on the basis of its ability to reverse vinblastine and doxorubicin resistance, and enhance uptake and retention of the P-glycoprotein substrate rhodamine 123, in the multidrug-resistant KB-V1 human cancer cell line at concentrations of 1 to 10 mg/L. Ketoconazole also; (I) potently inhibited the basolateral-to-apical flux of the P-glycoprotein substrate digoxin across the P-glycoprotein-expressing MDCK cell line (a canine kidney cell line that has been proposed as a model of renal tubular secretion), with an IC50 value of approximately 2 µmol/L; completely inhibited the polarized transport of digoxin in Caco-2 cells at a concentration of 10 µmol/L and displaced verapamil (a high-affinity P-glycoprotein ligand) from P-glycoprotein preparations using Caco-2 cells, with a K1 value of 1.2 µmol/L (IC50 13 µmol/L) in competition binding experiments, However, an IC50 value of 119 µmol/L has been reported for inhibition by ketoconazole of the polarized transport of the P-glycoprotein/CYP 3A peptidomimetic substrate K02 in MDR1-MDCK cells. In addition, the transport of rhodamine 123 by Caco-2 cells and across everted rat ileum, and the in vivo exsorption clearance of rhodamine 123 in rats, was only weakly inhibited by ketoconazole 25 to 40% inhibition at a ketoconazole concentration of 100 µmol/L. Although ketoconazole is a potent P- glycoprotein inhibitor in some systems, the results can vary depending on the in vitro model used and/or the P-glycoprotein substrate used in the assay (Venkatakrishnan et al., 2000).
C Ferrer Olmedo, et al. ONTRIBUCIÓN O Rivastigmina en pacientes con Parkinson y trastornos cognitivos enfermedad de Parkinson y trastornos cognitivos Experience with the use of rivastigmine in patients with Parkinson’s disease and cognitive disorders Ferrer Olmedo,*,† Soto María Cristina,* Ferrer Yenny,‡ Ferrer Arelis,‡Ferrer Yuseppi,¶ Hernández Armando,* Pachano Fr
8– Substantial Improvement Requirements- any substantially improved or substantially dam- aged (more than 50% of the value of the structure) must be brought up to NFIP and Georgetown County’s ordinance requirements. If the lowest fin- ished floor of the existing house is below the base flood elevation and the cost of the repair or renova- tions is 50% or greater then the structur
 CHAPTER 2
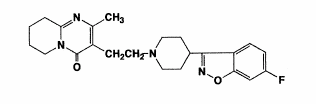
 type genetic polymorphism (Nyberg et al., 1993). Consequently, the clinical effect of the drug likely results from the combined concentrations of risperidone plus 9-hydroxyrisperidone. Plasma concentrations of risperidone, 9-hydroxyrisperidone, and risperidone plus 9-hydroxyrisperidone are dose proportional over the dosing range of 1 to 16 mg daily (0.5 to 8 mg twice a day).
7-hydroxyrisperidone
type genetic polymorphism (Nyberg et al., 1993). Consequently, the clinical effect of the drug likely results from the combined concentrations of risperidone plus 9-hydroxyrisperidone. Plasma concentrations of risperidone, 9-hydroxyrisperidone, and risperidone plus 9-hydroxyrisperidone are dose proportional over the dosing range of 1 to 16 mg daily (0.5 to 8 mg twice a day).
7-hydroxyrisperidone 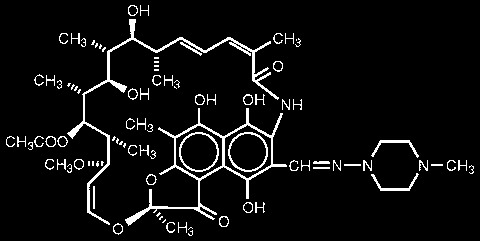 Figure 3. Structural formula of rifampin (William and Petri, 2001).